Project Overview
Research Scope
Low-cost imaging allows researchers to digitally record experiments, creating vast image databases for ongoing analysis. “Scientific image understanding” involves extracting data from these images, but each research question requires different measurements, meaning no single software can handle all image analyses. Research often need to re-annotate images or develop new software for each study. Machine learning (ML) offers a solution but typically requires large, annotated datasets, posing challenges for smaller, exploratory projects.
SEE Insight addresses this with tools for scientific image understanding in fields like biology and medical imaging. These tools integrate ML to assist with annotation, identifying potential algorithms based on the researcher’s workflow. The system either enhances the annotation process or provides a fully annotated dataset for further research.
Project Overview
Overview & collaborations
Project oversight…
Dr. Dirk Colbry
Jeff Siarto
Department of Computational Mathematics, Science and Engineering via Michigan State University
In collaboration with…
Tony Costantini
Kim Le
Yuo Kun
Project overview
research scope & timeline
The research scope centers on creating intuitive, transparent tools that keep researchers in control, providing both guidance for new users and advanced functionality for experienced researchers. I played a key role in conducting the foundational research, guiding the team through every phase of user testing and design iteration.
Phase 1
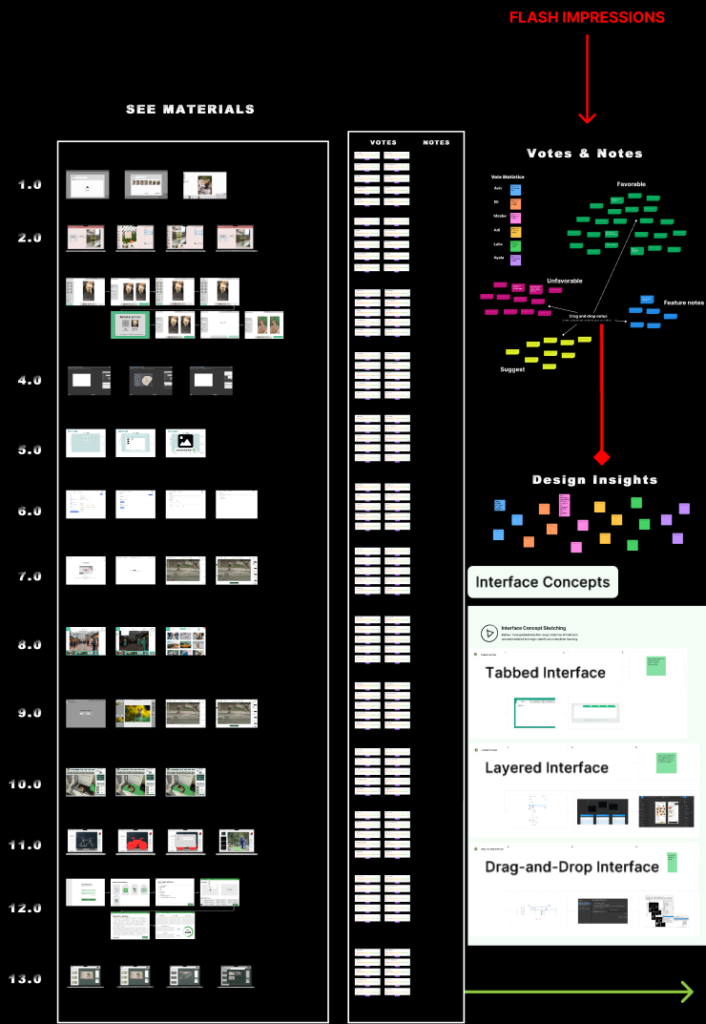
Existing Material Overview
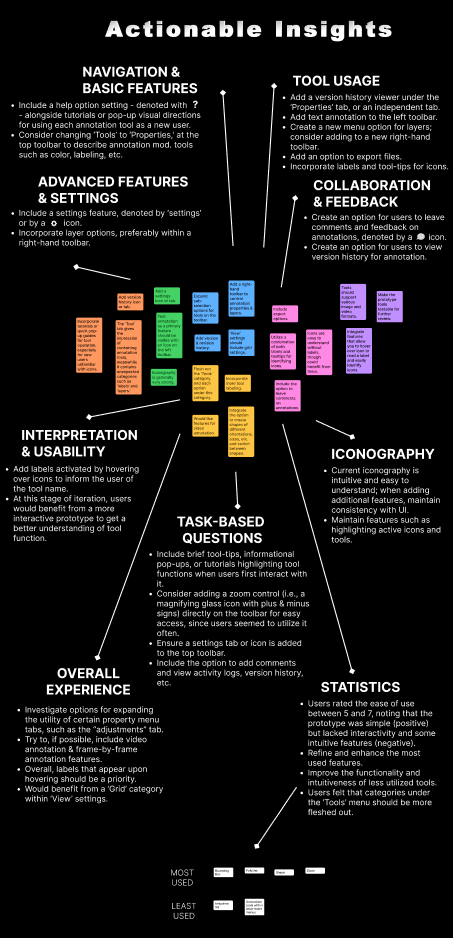
The initial material overview involved reviewing around 20 student concept prototypes similar to SEE Insight. This review provided valuable insights into current approaches and identified gaps in functionality and design for the product concept, alongside laying a foundation for informed user research beginning with one of two competitive analyses.
Visual Data
Phase 1b
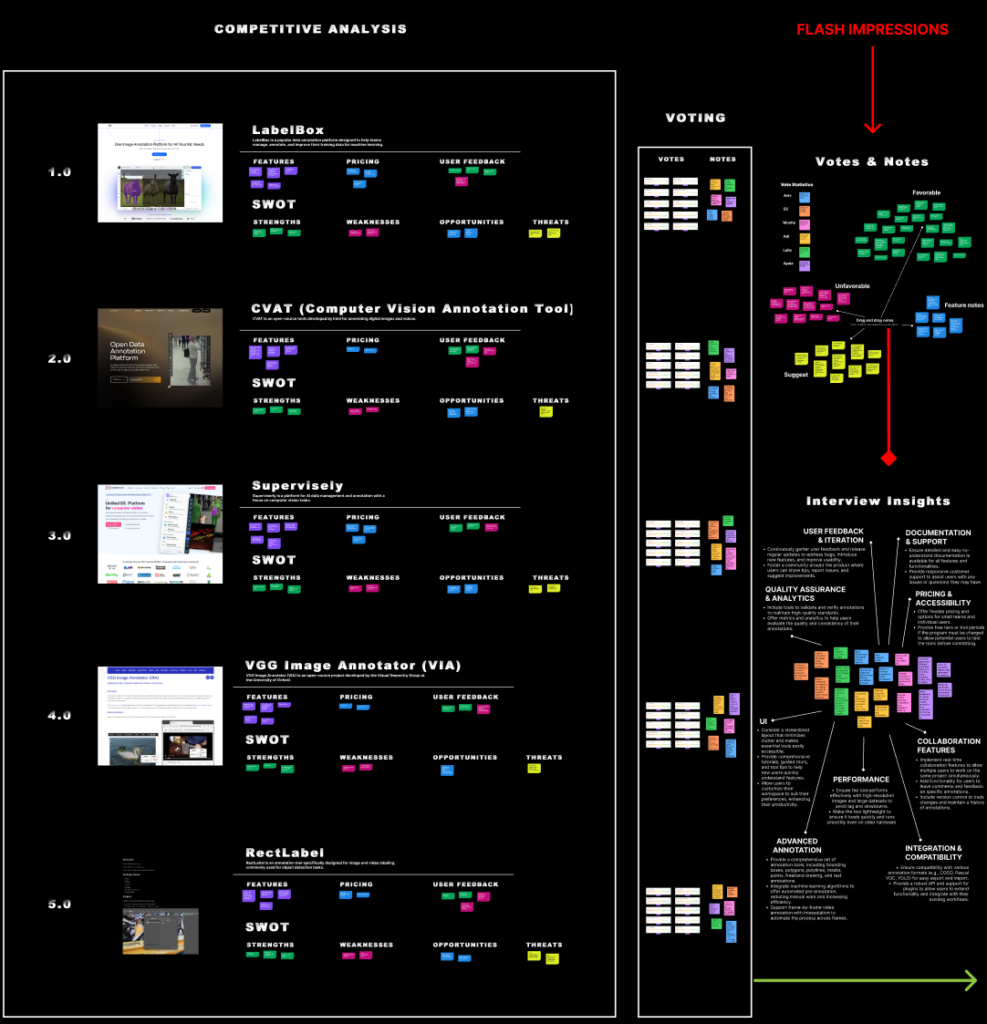
Competitive Analysis & Intake Interviews
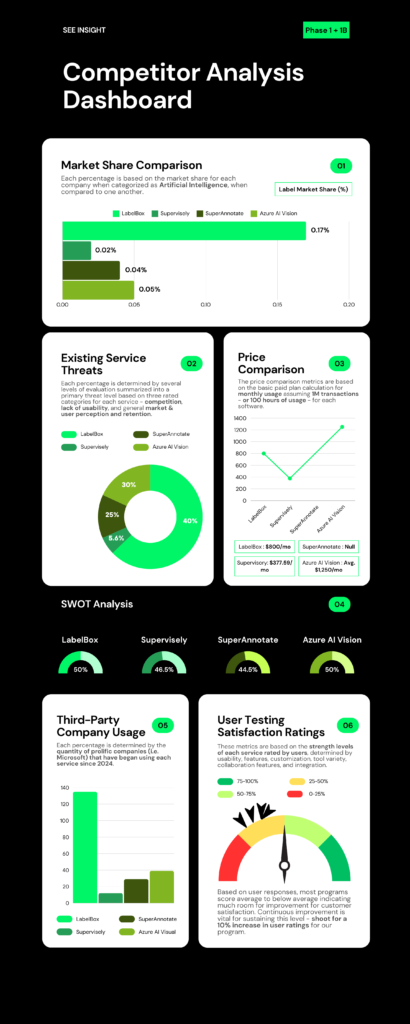
The formal competitive analysis involved reviewing five major companies – including programs like LabelBox and Supervisely – to assess existing annotation tools in the market. This analysis provided key insights into industry standards, strengths, and weaknesses, helping to identify opportunities for differentiation and innovation in SEE Insight‘s design and feature set.
Visual Data

Phase 2
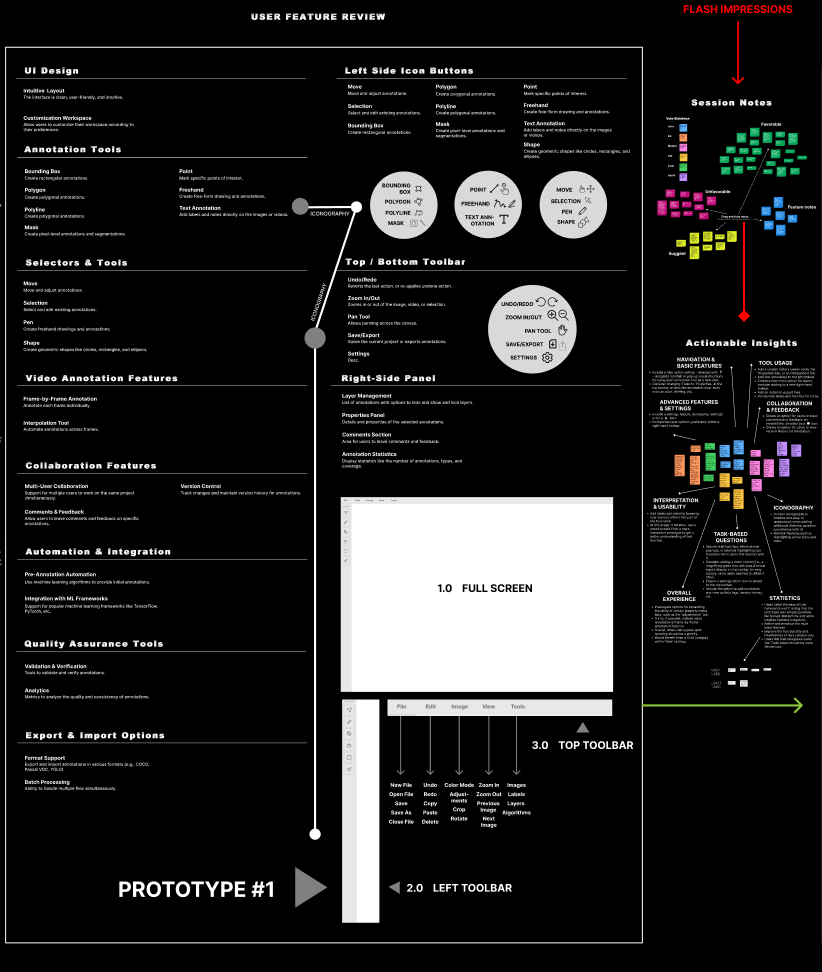
User Feature Review
The initial feature review involved primary users assessing both existing materials and programs from the competitive analysis, providing votes and insights on UI, performance, collaboration, and related categories. This review guided feature refinement and served as a crucial step in bridging the gap between a functional prototype and user needs.
Visual Data
Phase 3
Unmoderated Interview: Tool Features & Usage
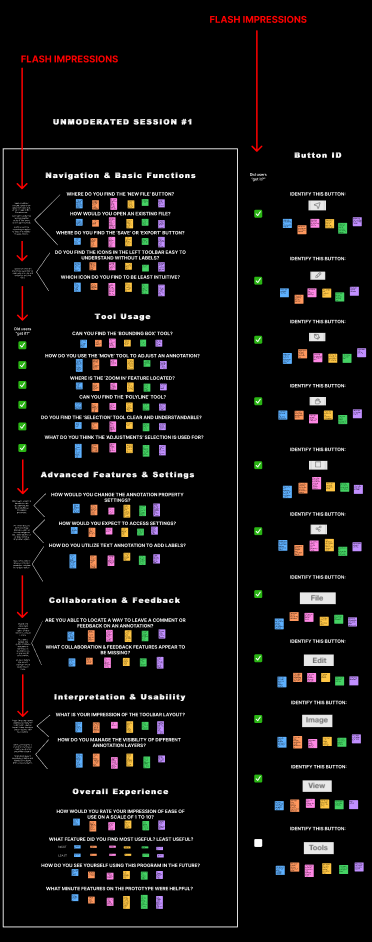
The unmoderated interviews gathered key insights from 22 participant questions across 6 categories: Navigation, Tool Usage, Advanced Features, Collaboration, Usability, and Overall Experience. This was essential for understanding user preferences and pain points, helping refine the prototype to align with real user needs and practical functionality.
Visual Data
Phase 4
Button ID & Card Sorting (Round #1)
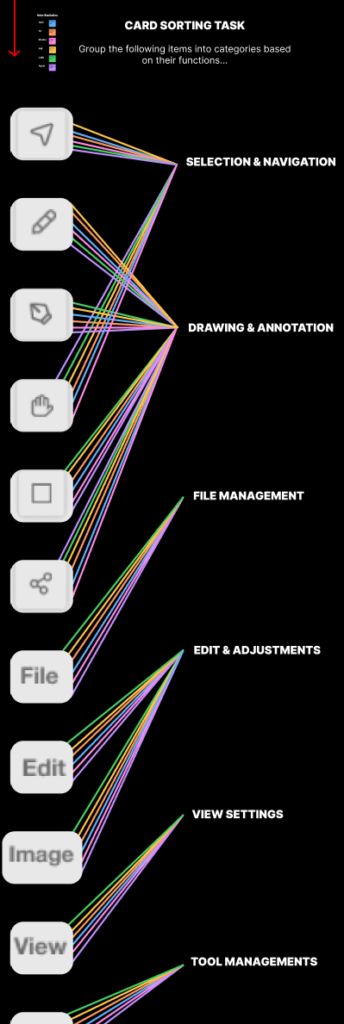
Moderated sessions focused on evaluating users’ ability to intuitively navigate the first design prototype. The Button ID task had participants identify different buttons to assess clarity. Card Sorting was conducted in which users grouped icons into primary categories based on their function.
Visual Data
Phase 4b
Card Sorting (Round #2) & Tree Testing
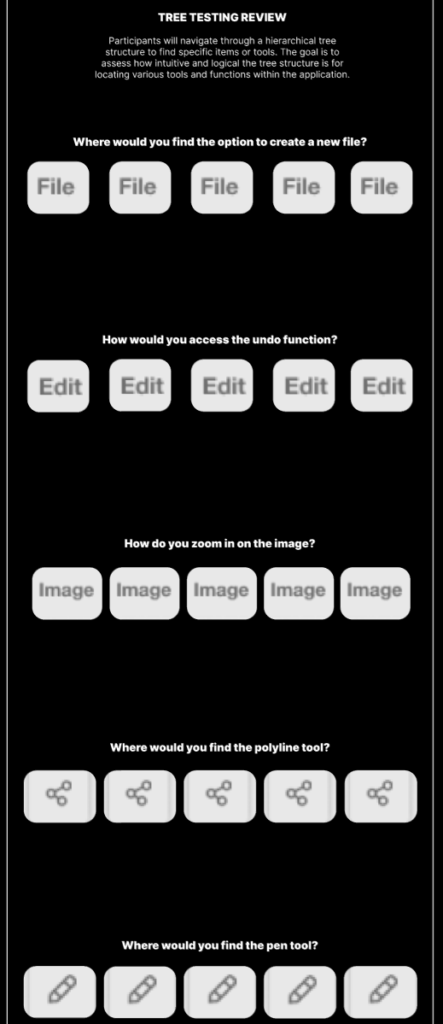
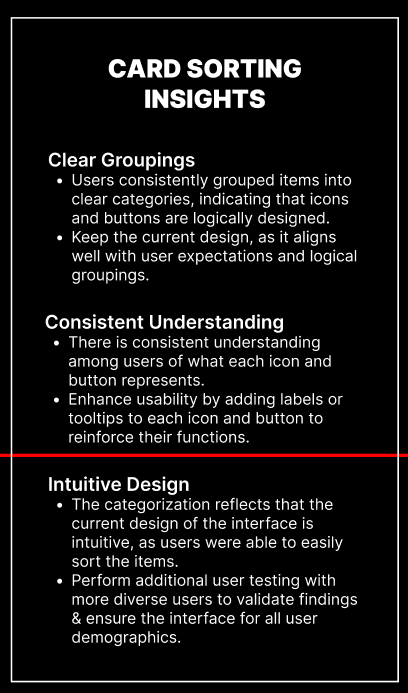
Another round of Card Sorting was conducted in which users grouped icons into primary categories based on their function. Tree Testing evaluated users’ ability to navigate tools across the prototype, determining how intuitive the navigation was.
Visual Data
Phase 5
A/B Testing & Heuristic Evaluations
In this phase, we tested different design versions to see which worked best. A/B testing helped us compare features, layouts, and interactions based on user preferences, while heuristic evaluations highlighted usability issues.
Visual Data


Phase 6
Closing Interview & Prototype Review
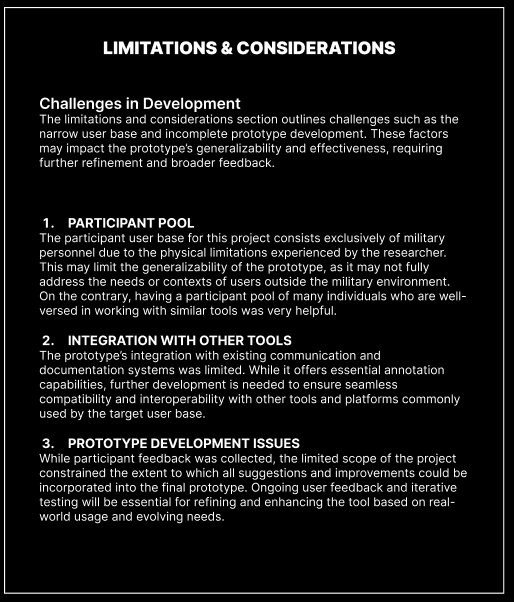
The final moderated session assessed the prototype through participant feedback, user insights, and limitations. Users suggested improvements for functionality and usability, while interviews showed how the tool fits into daily workflows. Limitations like a narrow user base and incomplete development mean further refinement and broader feedback are needed.
Visual Data

Project overview
Key Users & Demographics
User Sessions & Voting
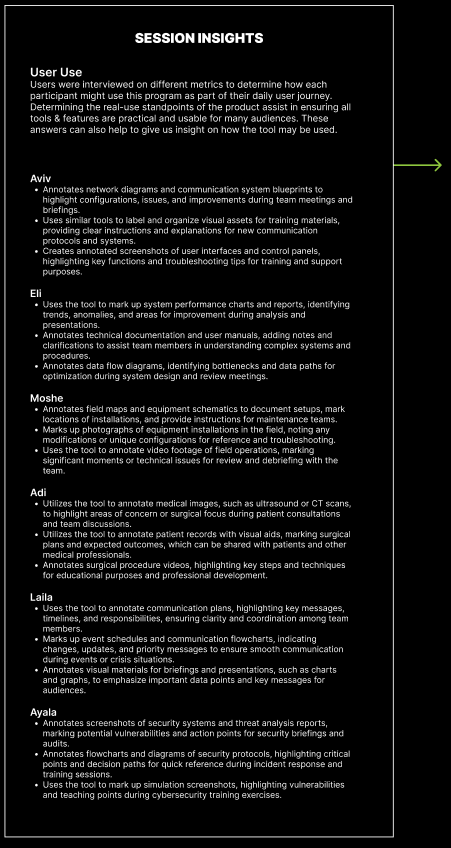
By exploring the unique perspectives of our five primary users, user sessions connect individual feedback to practical applications, ensuring that the design of SEE Insight aligns with real-world needs. The combined expertise of users for various practical uses, including potential design uses and even military uses, guided key decisions for improving the tool’s usability and adaptability.
User #1

AVIV
User Profile
A 29-year-old male with a B.S. in Computer Science, currently working as a Communications Specialist. With a background in both military communication systems and civilian technology, he is experienced in troubleshooting hardware, software, and network security protocols. His primary goal is to efficiently manage and maintain communication systems, with a focus on improving reliability and user satisfaction. Often working under high-pressure, time-sensitive conditions, he values efficiency and mission success. He prefers clear, intuitive interfaces and prioritizes reliable system performance. No specific accessibility needs have been reported.
User #2

AVRAHAM
User Profile
A 24-year-old male with a B.S. in Biology and an M.D. in Urology, working as a Urologic Surgeon. He has recently completed his medical school and specialized training, with experience in both civilian and military medical environments. His main objectives are to provide high-quality patient care while building expertise in urologic procedures. He is involved in patient consultations, diagnostics, and surgeries on a regular basis. Passionate about medical advancement, he values opportunities for professional growth and improving patient outcomes. He occasionally uses screen-reader technology when reviewing cases ahead of surgeries. Working primarily in sterile, isolated medical environments, he relies on concise and advanced medical protocols to guide his practice.
User #3

AYALA
User Profile
A 25-year-old female with an A.S. and M.S. in Cybersecurity and a B.S. in Computer Science, currently working as a Cybersecurity Specialist. With extensive knowledge in cybersecurity principles, she excels in threat detection and response. Her main objectives are to protect communication systems from cyber threats and ensure compliance with security protocols. She consistently monitors systems, performs security audits, and responds to security incidents. Highly detail-oriented and security-focused, she values robust security features and detailed logs. She works in a controlled, secure environment and uses a screen reader for multitasking convenience.
User #4

ELI
User Profile
A 40-year-old male with an A.S. in Information Technology, working as a Systems Analyst. He is experienced in system analysis, data reporting, and has knowledge of both military and civilian IT infrastructures. His primary goal is to enhance system performance and user experience by identifying and addressing bottlenecks. He regularly reviews system performance data and focuses on optimizing processes and workflows. He enjoys problem-solving and values precision, making data-driven decisions. Occasionally uses screen readers due to visual strain. He operates in an office environment with multiple screens, relying on detailed, actionable data and clear tools to improve systems.
User #5

LAILA
User Profile
A 62-year-old female with a B.S. in Engineering, working as a Network Engineer in Communications Coordination. With extensive experience managing communication channels and coordinating between departments, she frequently uses various communication tools and platforms. Her primary goals are to streamline communication processes and improve information flow across teams. She regularly manages schedules and coordinates messages to ensure smooth information exchange. Organized and detail-oriented, she values clarity and accuracy in communication. Occasionally, she requires adjustable text size for readability in her office-based environment. She prefers intuitive, organized communication tools with reliable user support.
PROJECT overview
prototype development
Click here for the Figma prototype.
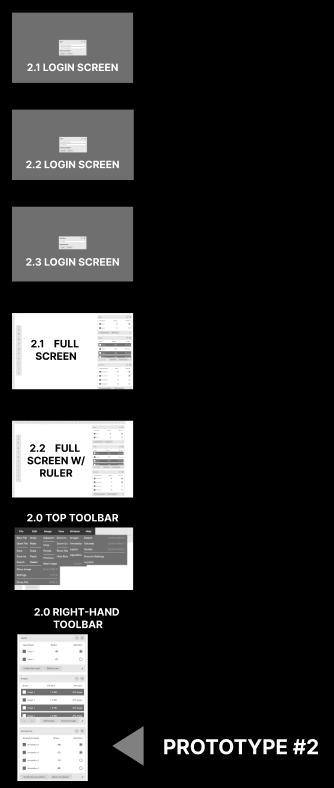
Prototype development is currently in the early iteration stages, focusing on refining the core features and user experience based on research and feedback. Leveraging a combination of research insights, technical skills, design expertise, and project management, our team collaborated to create and evolve the initial prototypes. These prototypes serve as a foundation for future testing.
Research Insights
User Insights & Design Elements
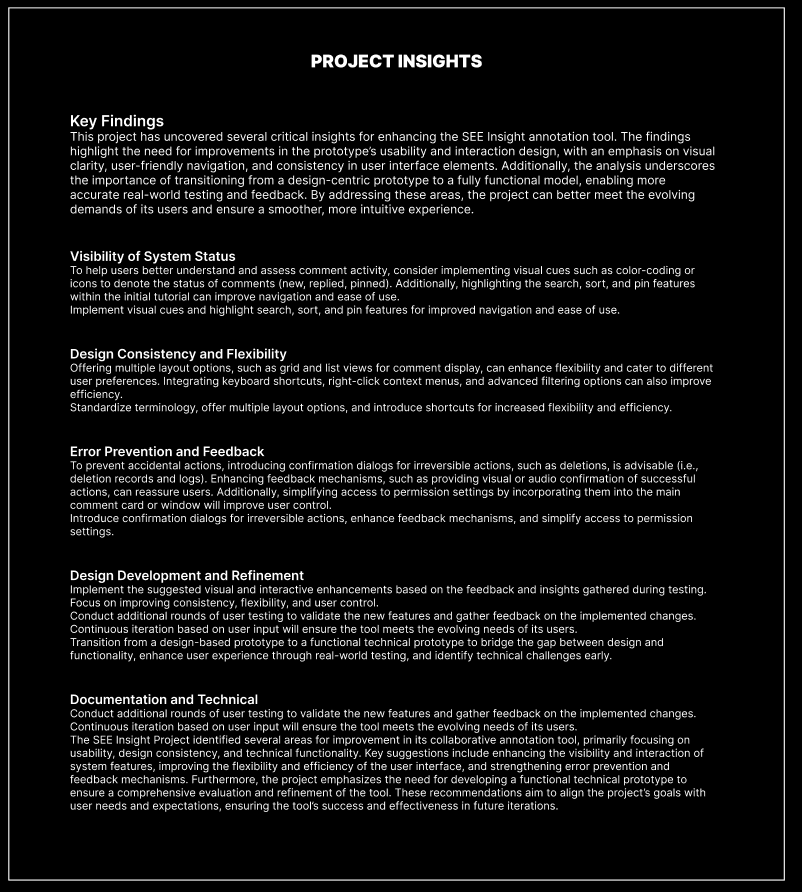
Through a series of interviews, usability testing, and surveys, we gathered key insights into how users interact with annotation tools and what features they value most. This data guided the development of intuitive design elements, ensuring the interface is user-friendly and efficient. We prioritized flexibility, customization, and accessibility, allowing users to tailor the tool to their workflows. These insights drove iterative design improvements to enhance overall usability and meet diverse user needs.
Research insights
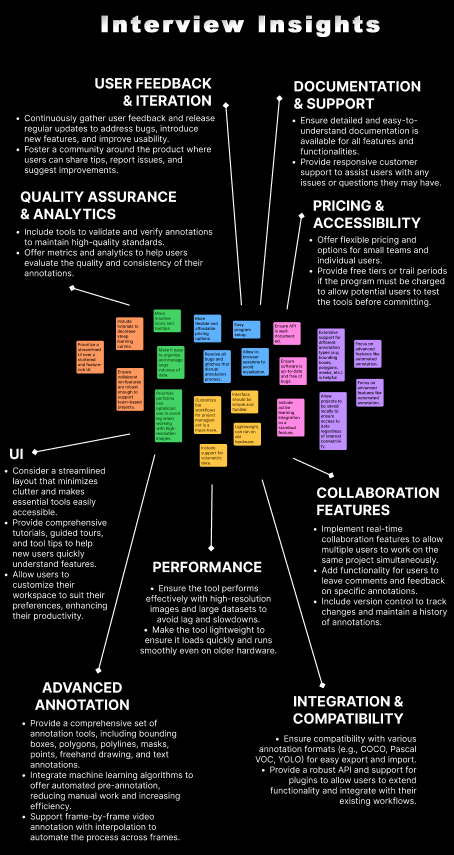
Insights I
User Feedback & Iteration
Regularly collect user feedback to identify bugs, refine features, and improve usability with timely updates. Build an active user community where participants can share usage tips, report issues, and suggest feature enhancements.
Quality Assurance & Analytics
Include tools like automated checks, peer reviews, and version comparison to validate and verify annotations, ensuring high-quality standards. Provide detailed metrics and analytics so users can assess accuracy, consistency, and improvement over time.
Documentation & Support
Provide clear, concise documentation for every feature, with step-by-step guides and examples. Ensure users can easily access this information through a help center. Offer responsive customer support via chat, email, or phone to promptly address any issues or questions.
User Interface (UI)
Create a clean, uncluttered layout where key tools—like annotation, navigation, and editing options—are easily accessible without overwhelming the user. This improves focus and efficiency. Include tutorials, walkthroughs, and tooltips to guide new users through key features quickly. Allow users to personalize their workspace by adjusting tool placement and settings to suit their workflow preferences, boosting productivity.
Performance
Optimize the tool to handle high-resolution images and large datasets without performance issues, ensuring smooth navigation and interaction. Keep the software lightweight by minimizing resource demands, so it loads quickly and runs efficiently, even on older or less powerful hardware.
Collaboration Features
Add real-time collaboration capabilities that allow multiple users to edit and annotate a project at the same time. Enable users to leave targeted comments or feedback on individual annotations, fostering detailed communication within the tool. Include version control to log and track changes, providing a complete record of annotation edits and updates.
Accessibility
Introducing confirmation dialogs for irreversible actions, such as deletions of records and logs, helps prevent accidental data loss, ensuring users can make informed decisions before proceeding. Provide visual or audio confirmations of successful actions that reassure users that their inputs have been recognized.
Advanced Annotation
Offer a comprehensive suite of advanced annotation tools, including bounding boxes, polygons, polylines, masks, points, freehand drawing, and text annotations. Integrate machine learning algorithms to enable automated pre-annotation, thereby reducing manual effort. Support frame-by-frame video annotation with interpolation to streamline the process across frames.
Integration & Compatibility
Ensure the tool supports a wide range of annotation formats to allow users to easily export and import their work without losing data or format integrity. Provide a robust API and plugin support, enabling users to expand the tool’s capabilities and integrate it smoothly with their existing systems and workflows for maximum flexibility and efficiency.
Design
Offer multiple layout options, like grid and list views, to give users the flexibility to organize comments in a way that best suits their workflow. Integrating keyboard shortcuts, right-click context menus, and advanced filtering features will streamline navigation and improve efficiency. Consistent terminology across the tool helps create a cohesive and intuitive user experience, boosting overall usability and satisfaction.
Research insights
INSIGHTS II
Practical Utility
Transition from a design-based prototype to a functional technical prototype, which will allow for real-world testing to enhance user experience and identify technical challenges early. Continue to allow tools to evolves in alignment with user needs and preferences
Customization
Research insights for customization emphasize the importance of mobile compatibility, enabling quick documentation and communication during field operations in various conditions. Advanced annotation features, along with integration with data analysis tools, are essential for efficiently marking complex performance charts and enhancing system analysis and presentations.
Collaborative Tools
Research insights highlight the need for secure collaborative tools for marking up security diagrams and flowcharts, supporting team-based assessments and training. Versatility in these tools allows users to adapt them for different tasks, while integration with presentation software ensures seamless annotation of communication plans and schedules, leading to clearer briefings and effective event coordination.
Prototype Development
Continuously implement targeted visual and interactive enhancements based on user feedback from testing sessions. Focus on refining consistency and flexibility while empowering users with greater control over their experience. Conduct additional rounds of user testing to validate the newly integrated features, gathering detailed feedback to inform continuous iterations.

Statistics
Users rated ease of use between 5 and 7, highlighting the simplicity of the prototype but pointing out a lack of interactivity and some unintuitive features. Focus on refining and enhancing the most frequently used features, ensuring they remain efficient and user-friendly. For tools that are less utilized, improve their functionality by ensuring they perform more smoothly and serve clear purposes within the workflow. Make these tools more intuitive to encourage more users to adopt them. Users also suggested expanding the categories under the ‘Tools’ menu to offer more depth and options for various tasks.